 Deutsch
 EN
EN Español
 Français
 Italiano
 Português
With marketing automation, it’s super easy to set up a workflow and just forget about it.
After all, having software automate tasks so you don’t have to worry about them is the whole point of automation, right?
While it may be easy to fall into this line of thinking, you should always be measuring the performance of your automation workflows.
This is because you want to make sure your business (and/or your customers) are getting value from the workflow. If not, then you are wasting resources and your customers’ time.
So, what exactly should you measure when evaluating your marketing automation strategy?
An effective marketing automation strategy allows you to:
- Generate qualified leads
- Convert those leads into customers
- Increase the average lifetime value of your customers
With that in mind, it makes sense that measuring these objectives is the best way to gauge the performance of your marketing automation.
In this article, you will learn the 3 best KPIs for marketing automation that measure the 3 objectives listed above.
1. Rate of Qualified Lead Generation
One of the main goals of marketing automation is to turn anonymous “leads” in your contact list to “qualified leads,” or potential buyers.
To do this, you set up workflows that “nurture” new contacts. Nurturing leads usually means sending drip campaigns to new contacts with content to educate them about the benefits of buying your product.
This content helps move them through the buying process (or towards the bottom of the “sales funnel” if you prefer the business jargon terminology). It also helps build awareness and trust with your brand.
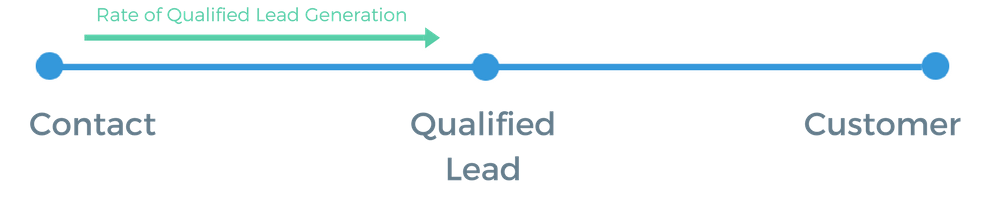
So, measuring the rate of customers that move from new anonymous contacts to “qualified leads” will give you a clear understanding of how well your nurturing workflows are performing.
But, how do you measure the number of “qualified leads?”
Track leads through the entire purchase cycle with lead scoring
By implementing a lead scoring workflow, you are able to assign point values to different actions that a new lead can take in the purchase cycle.
Once a contact performs a specific action, you can add the corresponding point value to their individual lead score. These actions could include:
- Filling out a contact form
- Downloading a piece of gated content/white paper
- Visiting certain pages on your site (pricing, specific feature page, etc.)
- Opening your emails
- Clicking on certain links within those emails
Basically, if an action is correlated with purchasing behavior (i.e. it is one of the steps that a customer takes that leads them more closely to buying), then you should include it in your lead scoring.
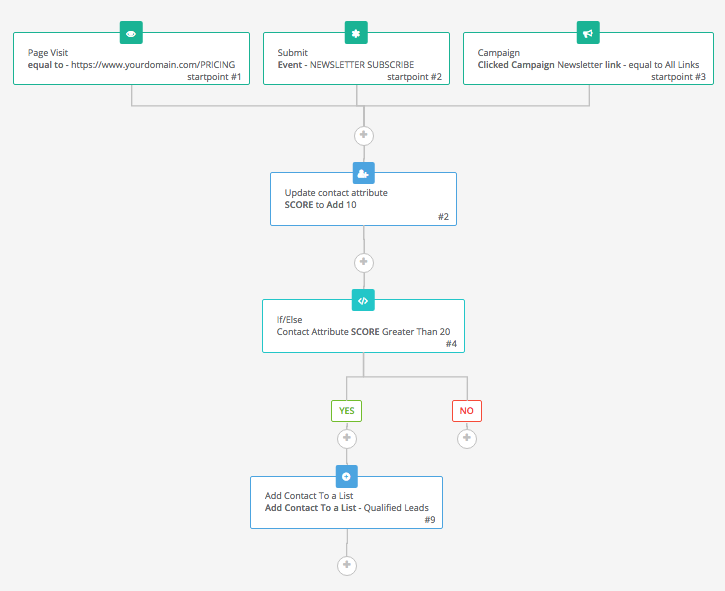
Once you have the lead scoring workflow in place, you can use each contact’s lead score to determine if they are “qualified.” You can do this in three easy steps:
- Choose a score that you feel someone should have in order to be a qualified lead.
- Create a list called Qualified leads.
- Create an automated workflow that automatically segments contacts into that list once they have the score that you determined in step 1.
Calculate the rate of qualified leads
Now that you have your list of qualified leads setup, you can calculate the rate of qualified leads generated through your nurturing campaigns.
To calculate this number, simply take the number of contacts in your qualified contacts list and divide it by the total number of contacts you have in your database.
To be even more precise in your analysis, try the following:
- Segmenting leads by month to get a monthly qualified leads rate (MQLR).
- Observing the month to month change in MQLR.
- Observing the overall evolution of the ratio between total qualified leads and total contacts.
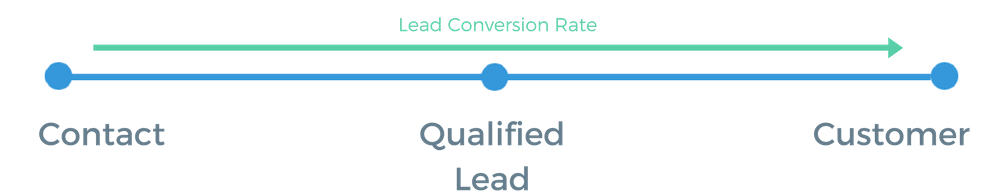
2. Total Conversion Rate of Leads to Customers
Depending on the length of your purchase cycle, this KPI will be calculated in different ways.
For the sake of simplicity, I will talk about 2 different examples in this section:
- Short purchase cycle (e.g. Ecommerce)
- Long purchase cycle (e.g. SaaS, service industry, etc.)
In the first case, it can definitely be interesting to look at the actual conversion rate of leads to customers. The short purchase cycle allows for leads to convert more quickly.
In the longer purchase cycle companies, it’s not so simple. Because there are so many leads that fall out of the funnel somewhere along the way, this number isn’t going to give you much. The solution: calculate the conversion rate of only the qualified leads to customers.
Short purchase cycle lead to customer conversion rate
In businesses with short purchase cycles, such as ecommerce sites, marketing automation can have a clear and direct effect on the conversion rate from lead to customer.
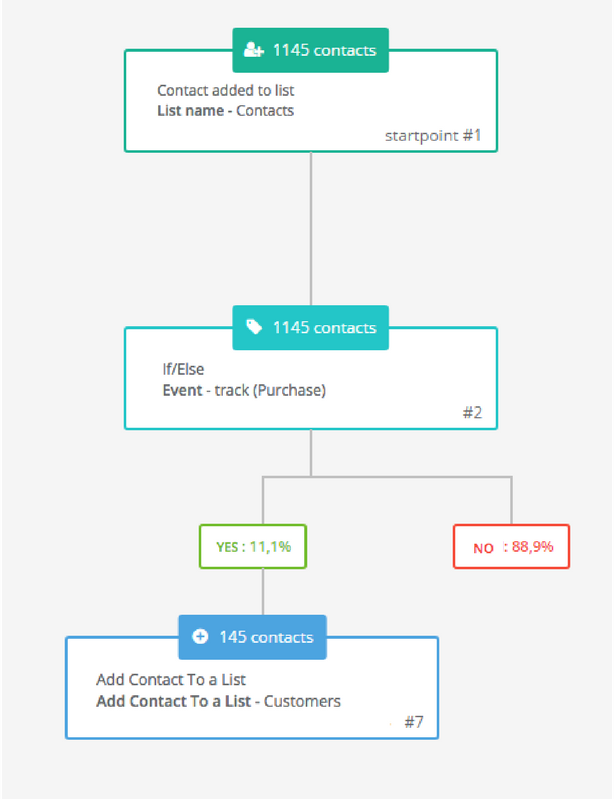
The easiest way to track this using Sendinblue is to set up an automated workflow.
Once a contact enters your database, the workflow waits for them to make a purchase. As soon as they make a purchase, add them to a list of “customers.” As you can see below, Sendinblue also shows you the conversion rate directly in the workflow (in this case it’s 11.1%).
Long purchase cycle qualified lead to customer conversion rate
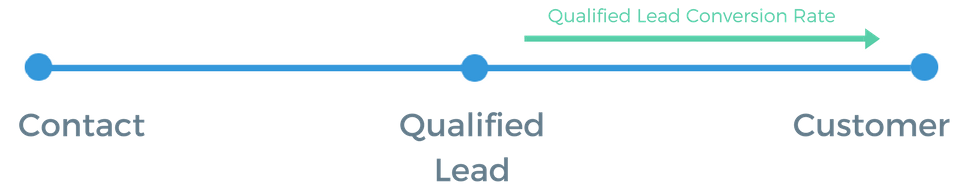
For long purchase cycle businesses, such as B2B SaaS companies, it is much more interesting to calculate the percentage of qualified leads that convert into customers.
This is due to the fact that it is much easier for contacts to fall out of the funnel because it is so long. That is okay though — as customers for these businesses have a much higher lifetime value as well.
So, assuming you’re doing everything right on the first KPI (qualifying your leads), then calculating this KPI should be a breeze.
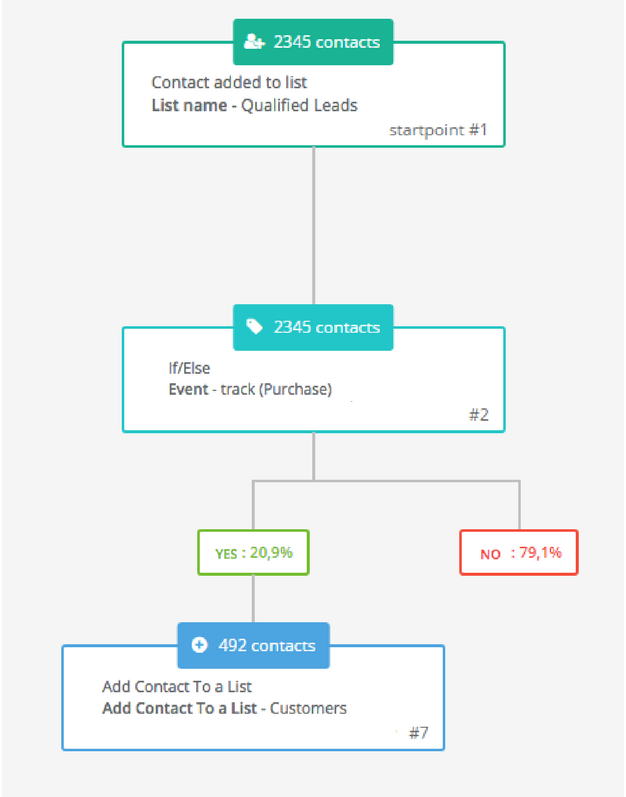
Just like in the previous example — all you need to do is create a workflow that starts when a contact is added to the “qualified contacts” list.
From there, wait until they make a purchase, then add them to a list of “customers.”
3. Average Value of Qualified Leads
The KPI focuses on the average value that you are getting from your leads (in terms of revenue).
It can be another great gauge in determining whether your qualified leads are actually qualified.
Most importantly though, this KPI measures the value your marketing automation strategy provides to your overall business numbers.
So, how do you calculate it?
This KPI requires 3 metrics in order to be calculated:
- AMR – Average monthly revenue per customer
- ACLD – Average customer lifetime duration in months (how long do they stay with your business)
- QLCR – Qualified lead to customer conversion rate
Then you just use the formula below to calculate the average value of your qualified leads:
Example
Say you have a business that looks like this:
- Your average customer provides $100 in monthly revenue
- Customers typically stick around for 2 years on average (24 months)
- Your qualified leads conversion rate is 20%
By plugging in the numbers to the equation above you get the following:
Not too shabby!
To take this KPI even further, you can compare it with the value of your overall leads (just switch QLCR with lead conversion rate).
Now that you have a better idea of how to measure your marketing automation workflows and their effectiveness, it’s time to try it out on your own!
Do you have other KPIs for marketing automation that you use to track performance? Let us know in the comments below!
Check out these additional articles:


Comments
Also… Is september 27-28 little early.
Also… Is september 27-28 little early.